ESP 1 Studying
#APS111
These are notes I made to help me study for the APS111 final exam. I got a mark in the 80s on the final, so I'd say it was decently effective.
Tasks
Practice
In-Class Practice APS111 Case Study
Client Statement
An initial statement by the client of a project that details what the client wants from the project.
- It may be short, and it may be long.
- Clients may include possible constraints or objectives that they want out of the project, but it is the job of the designer to determine if these are viable.
- The client may state a want, but that does not necessarily mean that it is something that the client needs.
- Thus, it can include bias, implied solutions, errors, and/or assumptions.
Problem Statement
A statement written by the engineering design team describing their interpretation of what the problem of the project is, based on both the client statement and external research. It must include:
- Context: Who is the client? What information exists on the problem currently, that is relevant to the understanding of the reader?
- Gap: What is the "hole in the universe", that is causing the problem that the client wants solved?
- Need: The specific thing, be it technology or otherwise, that is required to fill the gap, i.e. solve the problem.
- Must be solution-independent; cannot include any implied solutions.
- Must not be result-based; should instead be something that can be designed (e.g. not "a solution that increases happiness")
- Scope: The limits/boundaries of the problem you are trying to solve.
- Should be the (abstract) space that a potential design can occupy, rather than what the design can't do (that goes in the constraints).
- However, the constraints should reflect the PS and everything else that comes before it, so it can (and should) have stuff that overlaps the scope?
Why why why method
A method for determining a more specific gap/need/scope of a project.
- Involves iteratively asking why a given statement is true.
- For example: Client states that they want a device to prevent texting.
- Why? Texting on a phone is distracting for drivers and can lead to accidents.
- Why? Texting at the same time as driving requires a significant amount of attention from the driver, which the driver cannot spread effectively across both tasks.
- Why? Human brains are fundamentally not parallel systems; they cannot do multiple tasks simultaneously very effectively, and they do not have two sets of eyes.
- The appropriate appropriate need is likely in the middle.
- We cannot change how human brains function (probably), so we define our need as some solution that decreases the amount of attention that a driver must spend away from driving, while still allowing them to text.
Service Environment
The service environment is a the specific location that the project will occupy. This must only be stuff that would exist, even if the design did not exist! It includes the following parts:
- Physical environment
- Stuff that is physically there, excluding living things. E.g. pressure, temperature, precipitation, wind, etc.
- Virtual environment
- Existing virtual infrastructure. E.g. cell phone towers, satellite coverage, etc.
- Living things
- ALL living things that are in the environment, including people, animals, and insects.
The SE should consist of both primary and secondary research. Primary research is done through observation, and should include aspects that cover POEMS:
- People
- The demographics, behaviours, traits, quantity, and other characteristics of the people that are using the physical environment.
- Objects
- The physical objects that people are currently interacting with in the SE.
- Environments
- Observations about the architecture, lighting, temperature, atmosphere, etc.
- I.e., not stuff that people are directly touching, but stuff that still impacts the vibes of the area.
- Messages
- The tone or message of language used in the environment, or relating to the environment.
- E.g. advertisements related to it? Or people's perception of what it is like.
- Services
- All services, apps, tools, and frameworks used in the SE.
- E.g. phone apps?
The service environment should be completely devoid of analysis; it should only describe what is observed within the area, or what has been researched in regards to it.
Stakeholders
People or groups of people that are impacted by a design and have an influence on the design.
- Animals/plants/Earth/ocean are not stakeholders, but their interests may be reflected by other stakeholders, such as animal protection groups.
- The design team is not considered a stakeholder by convention.
- The ways in which they are impacted by a design are obvious.
- Stakeholders must be reflected in FOCs or else you're basically saying they don't matter.
Stakeholder Analysis Matrix
A matrix with interest on horizontal axis and influence/impact on vertical axis
- Interest: How much a stakeholder is interested in your design.
- Influence/impact: how much influence does the stakeholder have over the design team.
Key stakeholders are in the top right quadrant.
| Low interest | High interest | |
|---|---|---|
| Low influence | Less-important | |
| High influence | Important |
Detailed Requirements
Detailed requirements are a section of the PR/CDS that houses the Functions, Objectives, and Constraints.
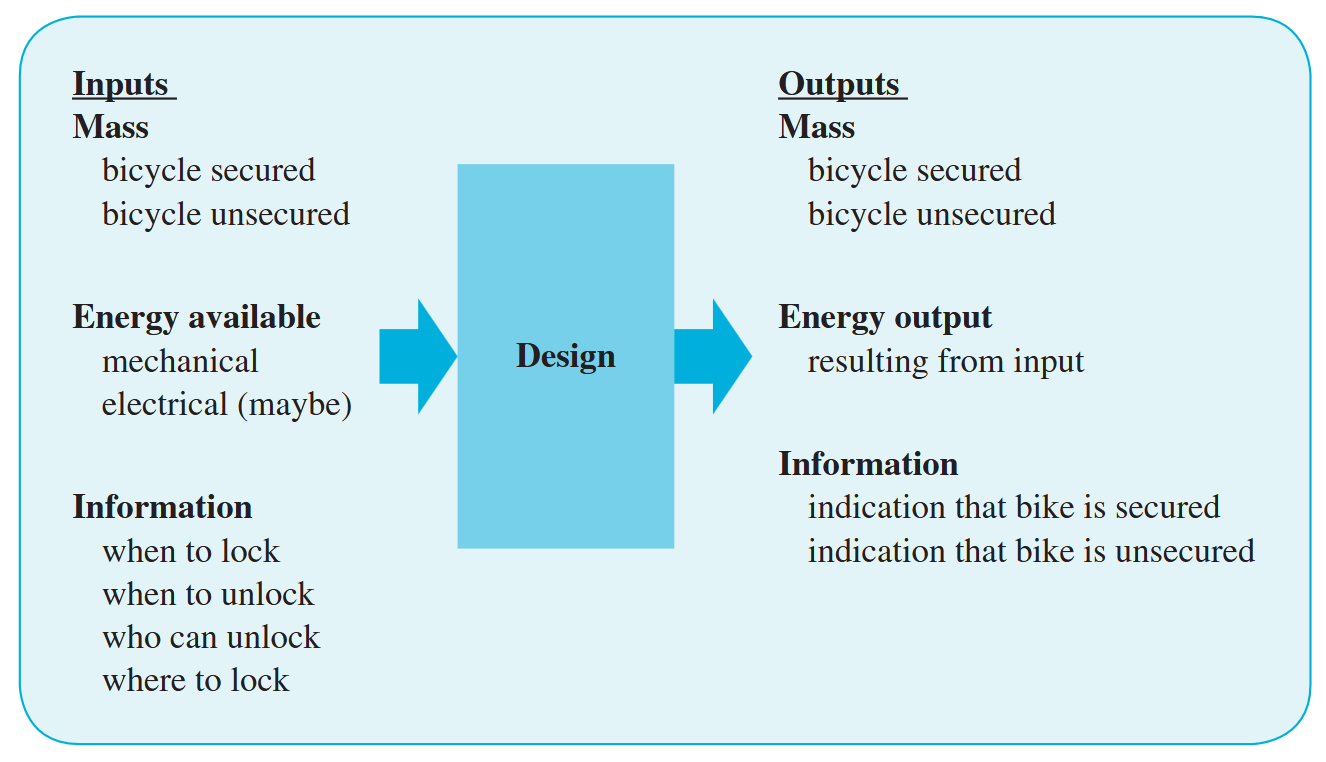
Black Box Method
Black box method is a tool mainly used to generate functions, but can also be used for objectives and constraints.
- First, describe all mass, energy, and information that is going into a design (left hand side of diagram).
- Then, describe all mass, energy, and information coming out of a design (right hand side of diagram).
- For both the inputs and outputs, be specific about the what the input/output is, rather than just saying a functional basis. E.g. for information, you could say "when to unlock" for a bike lock.
- Do not specify the means through which these things are achieved, that is the "black box" part of it.
This method decomposes the functions of a design, and helps you outline the expectations that you have for its functionality.
You can also derive objectives and constraints from this method, based on the available energy, mass, or information inputted.
Pairwise Comparison
A pairwise comparison is a tool that is often used to rank objectives, but can be used for other things. Simply put, it ranks the items in a list.
- To perform a pairwise comparison, form a matrix/table with each list item on both the horizontal and vertical axes.
- In each cell of the table/matrix, compare the horizontal item with the vertical item.
- If it is more important, then assign the cell a value of 1.
- If it is less important, then assign the cell a value of 0.
- The pairwise comparison is always comparing the row item vs. the column.
- In the rightmost column, tally up the scores in the corresponding rows for each list item.
- The items with the highest tallies go to the top.
Example:
- The items with the highest tallies go to the top.
| Item 1 | Item 2 | Item 3 | Item 4 | Score | |
|---|---|---|---|---|---|
| Item 1 | - | 1 | 0 | 1 | 2 |
| Item 2 | 0 | - | 0 | 1 | 1 |
| Item 3 | 1 | 1 | - | 0 | 2 |
| Item 4 | 0 | 0 | 1 | - | 1 |
In the first row, Item 1 is more important than Item 2 and Item 4, but not Item 3.
Functions
The functions describe what the design must do for it to fulfill the need in the Problem Statement, and nothing more.
- It should not include any adjectives or adverbs, or be something that describes how well a design functions; that goes in the objectives.
- The functions must be a yes or no type of deal; do the solutions fulfill the functions, or do they not?
Functional basis
Functions are built upon a functional basis, which is the most low-level version of a function. It only has a verb and a noun, nothing else.
- The noun must either be mass, energy, or information.
- The verb can come from the list of verbs they provide, but it is not strictly necessary to use them
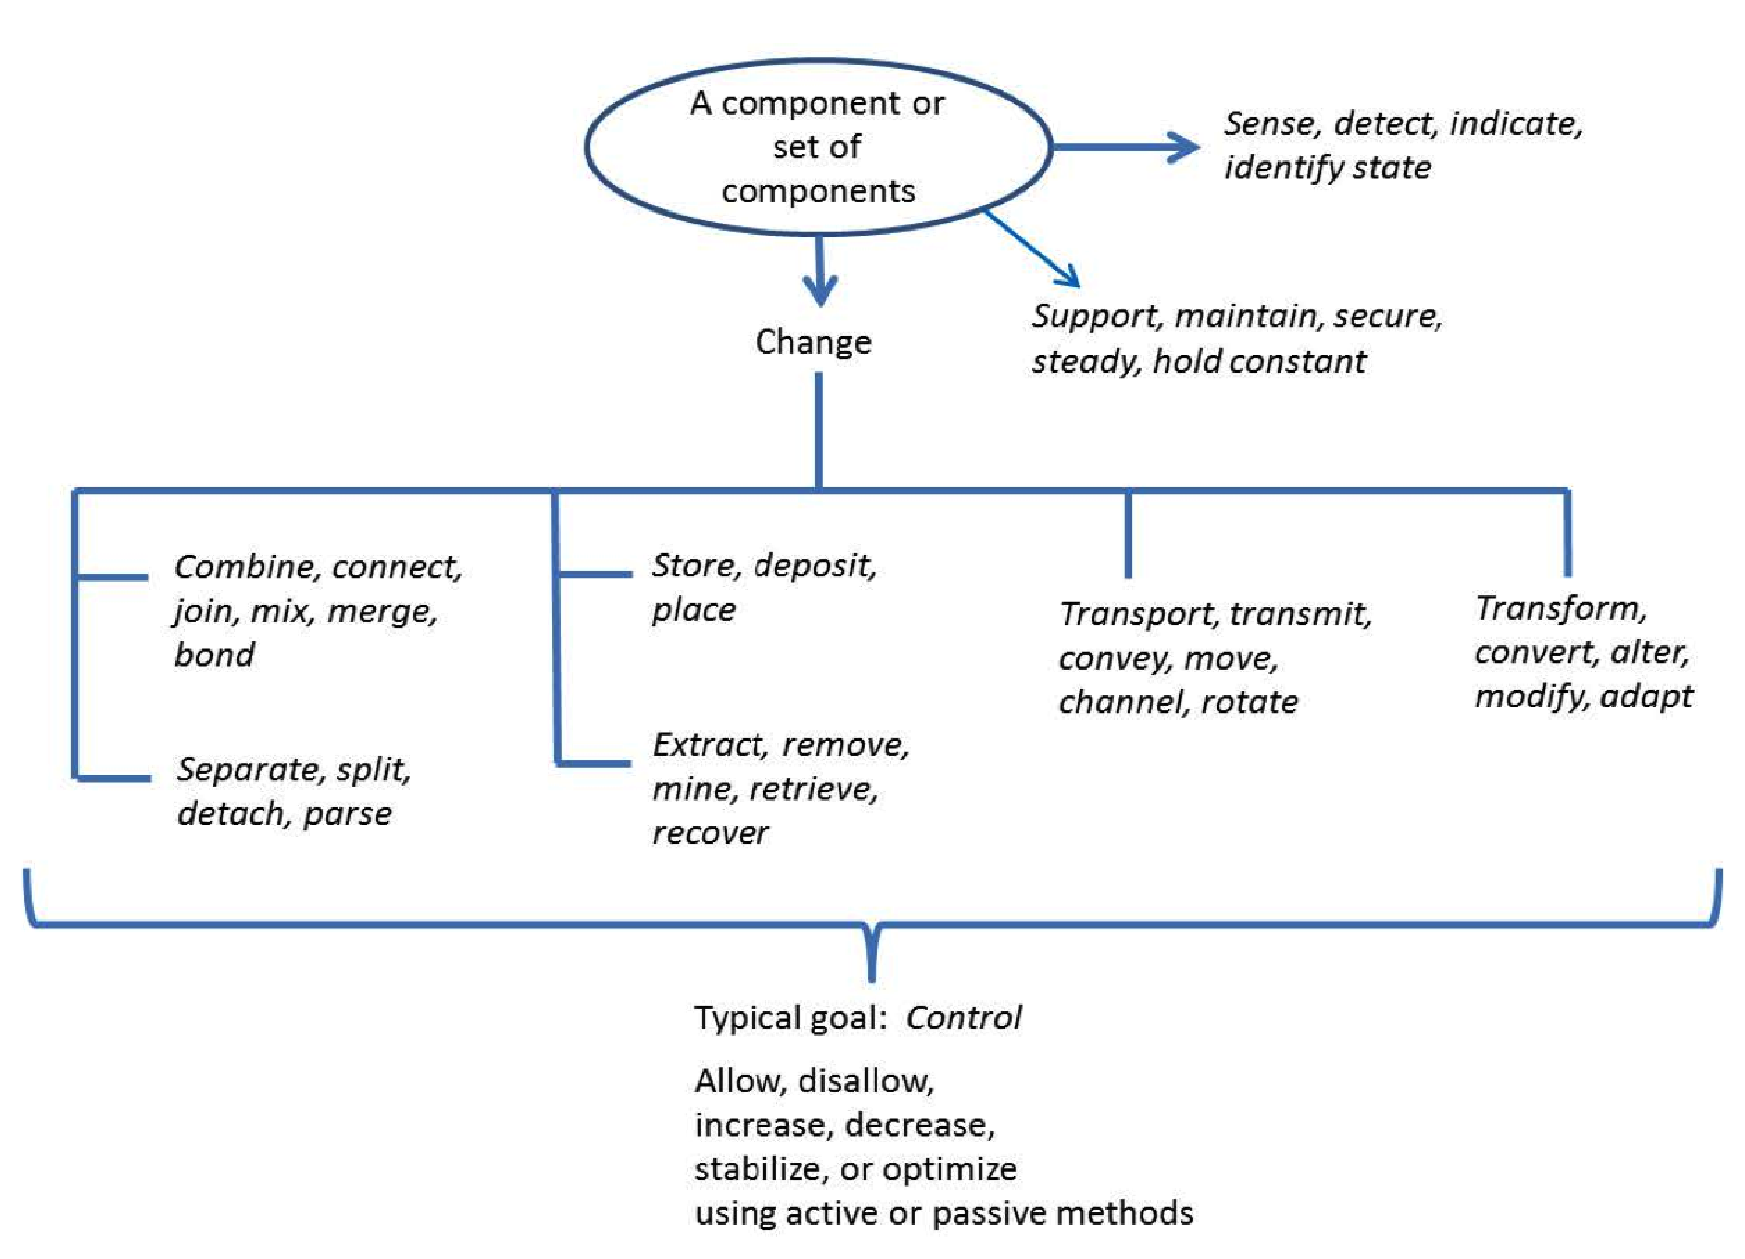
This method can be used to generate more specific functions, as it provides a basis upon which those functions can be created.
Structural Decomposition
Decomposing a problem into its structural elements, which are discrete physical units or subsystems.
- E.g. vacuum cleaner --> electrical supply + human-interface handle + power conversion device + etc.
- Generally not as useful as functional decomposition, as it focuses on physical structural elements rather than functional parts—which are easier to design for.
Functional Decomposition
Decomposing a problem into its functional elements instead of structural, which essentially means dividing an individual task into different functional units or tasks that enable that task to occur, which is independent of physical structure.
- E.g. for a vacuum cleaner to clean a surface, it must:
- Suck air and dust from ground
- Separate the air from the dirt
- Store the dirt
- Exhaust the air
Means Analysis
A method of generating more functions. It involves performing a functional decomposition, and coming up with as many means that fulfill the functions you've already come up with (through that decomposition).
- Using those means, see if there are any common functions that they all fulfill.
- These commonalities can then be used to create new secondary functions, or specify pre-existing ones.
Objectives
What the design should be, formatted as follows:
The design/solution should be/have (descriptor); it should meet some metric, with some specific units/measurement specification.
Note that the objectives should not have adjectives or adverbs in them; they should be specific.
- Good: The design should withstand 80mm monthly average rain
The objectives should be measurable, and can be formatted as a table. - In the table, there should also be a column for justification.
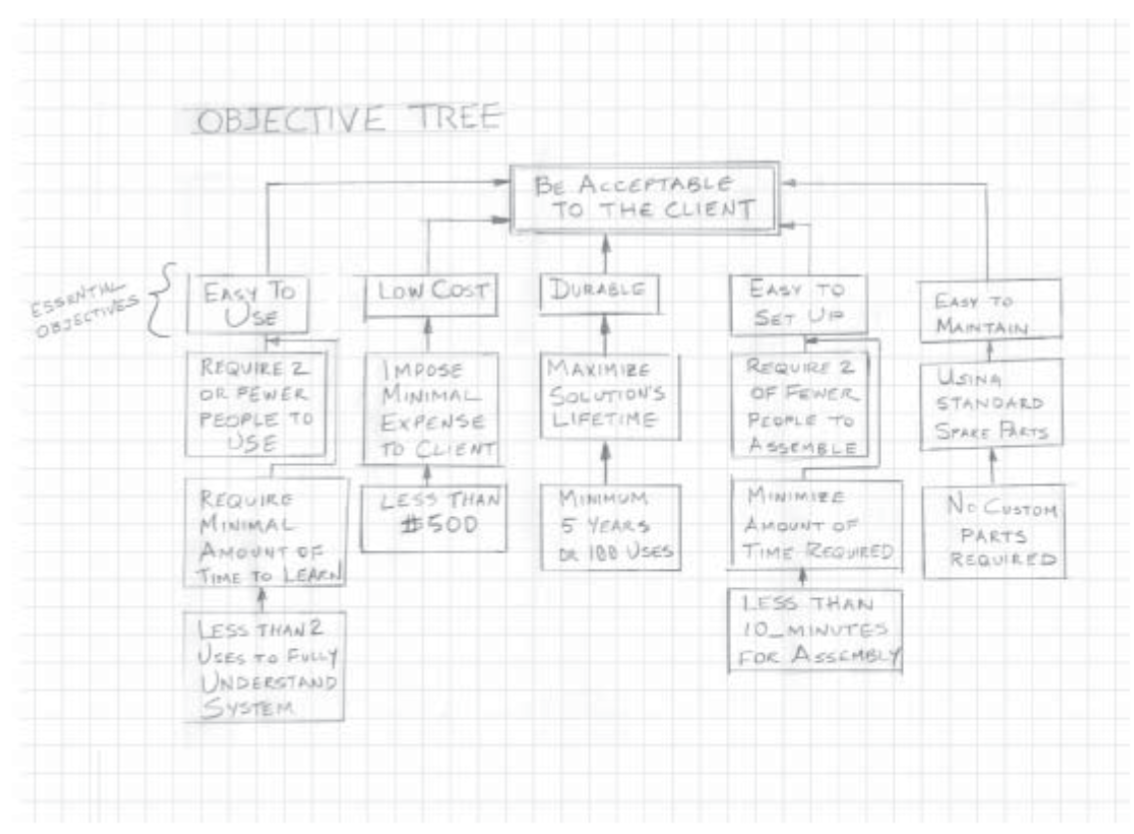
How-Why Tree
Essentially just a tree diagram that has the general goal at the top, and the specific objectives at the bottom.
- The "how" part is an arrow pointing downwards, and is basically becoming more specific.
- The "why" part is an arrow pointing upwards, and leads to the original general goal.
Note that the how-why tree can have multiple levels, so you can have "general" objectives becoming more and more specific as you go down.
Constraints
Constraints are specific and absolute limits that the design must not cross.
- Constraints can be related to an objective, but it doesn't have to be.
- They must be worded with "shall" or "must"
- Meeting the constraints is a yes or no type of situation; solutions either pass or fail, and if they fail, they either need to be modified or discarded.
- Constraints should have a metric if possible, but sometimes a specific value is not feasible or relevant.
- E.g. "no trees shall be removed"
Constraints are derived from the following sources:
- E.g. "no trees shall be removed"
- The client themselves
- Relevant codes, regulations, and standards
- Stakeholder interests
Idea Generation
Idea generation is the process of coming up with solutions that fulfill the functions and constraints, but not necessarily the objectives.
- Full solutions are made up of multiple means that each fulfill one or more of the functions. So, full solutions cover all the functions.
- There is a generally recommended order to idea generation, as some work better as something to compliment already generated ideas.
- Brainstorming
- Lateral Thinking
- Random Stimulation
- Reversal Method
- Blue Sky Thinking
- Magic Solutions
- Morph Charts
- SCAMPER
- Analogy
- TRIZ
- Brainstorming
Brainstorming
Brainstorming typically occurs both in groups and individually.
Free Brainstorming
A method of brainstorming that is essentially just members within a group saying their ideas out loud, and someone recording them. This occurs for a set amount of time, after which the group takes a break and then restarts the process.
- Advantages: allows people to build off of each other's creativity in a short period of time.
- Disadvantages: chaotic, and doesn't consider the voices of people that are quieter in the group.
Structured Brainstorming
A "structured" process by which ideas are generated, specifically as a group. However, unlike free brainstorming, each team member records ideas individually for 15-20 minutes, and then shares with the rest of the group.
- Advantages: Eliminates the chaos of free brainstorming.
- Disadvantages: Makes it harder to build off of other people's ideas, as idea generation is more isolated.
Reversal Method
A method of generating ideas (generally) through which you "reverse" the direction/sequence of idea generation.
- I don't actually understand how you apply this, and the textbook does nothing to explain it. Oh well!
Random Stimulation
Looking for some random word/concept/idea and trying to incorporate it into your line of thinking, and then using those to create more concrete and realistic ideas. This may not actually lead to anything that is feasible, but may open your mind to new ideas.
- E.g., what if the Bahen courtyard used dogs to serve food?
- This can open up your mind to using animals as part of a solution, perhaps for dealing with other aspects such as the "retaining users" part.
Blue Sky Thinking
A method of generating ideas, wherein you consider absolutely zero constraints. This is to help eliminate any preconceived notions, and can help widen your design space.
- E.g. What if there was no budget, no physical constraints, etc.?
- Obviously you have to bring it back down to Earth at some point, but this comes later.
Magic Solutions
Basically just coming up with a solution without a specific realistic way for that solution to occur. It can be thought of as coming up with a result, and then trying to fit a realistic solution or explanation for that result after the fact.
- E.g. the Bahen courtyard will somehow automatically sort the discarded waste.
Morph Charts
A graphical process of putting ideas together into full solutions.
- The ideas in the morph chart do not have to be extremely detailed, and so full solutions cannot just be an unmodified combination of means from the morph chart.
- The columns are specifically for the secondary functions; objectives and constraints are considered later.
- To generate full solutions from a morph chart, an easy way to do it would be to randomly select means from each secondary function and combine them to see if they work.
You know what a morph chart looks like.
SCAMPER
An acronym that can be used to modify or improve already generated ideas. It stands for:
- Substitute
- Combine
- Adapt
- Modify
- Put to other use
- Eliminate
Basically, you are trying to move around means in a full solution to try and see if they fit better in other places, as well as trying to modify parts of each mean or full solution to see if they work better with other components.
Analogy
Analogy is essentially looking to pre-existing solutions to tangentially-related problems, both artificial and in nature.
TRIZ
Stands for "Theory of Inventive Design", which is a set of 40 inventive principles that challenge the conventional thinking that engineers may adopt.
- It tries to find inventive solutions to technical contradictions inherent to a problem.
- E.g., I need lots of money, but I have no time to work. So, I will just borrow money lol.
Benchmarking
An analysis of an existing technology that directly solves the problem you are trying to deal with, which helps the design team identify the requirements that a design might have, as well as to compare the design ideas to something that already exists.
Idea Selection
Idea selection is the process of taking all the ideas you generated in idea generation, and choosing the best ones. This should be done in a general -> specific order:
- Feasibility Check (not really part of idea selection, more of a filter)
- Multi-voting
- Graphical Decision Matrix
- Pugh Method / Weighted Decision Matrix
Feasibility Check
This is the process of seeing if every idea fulfills the functions and constraints; if they don't, then they must either be modified or discarded.
- They must also be feasible; that is, they must actually be physically possible, and technology must currently exist to fulfill it.
Multi-voting
A simple process of cutting down the number of solutions, wherein each team member is assigned a certain number of votes, and is made to distribute one to each solution they think is good. Once each team member has voted, the votes are all tallied up and counted, and the ones with votes are pooled together.
- This process is repeated until a list with desired length is attained.
- You can either choose to remove the ones with no votes, or the ones with the fewest number of votes.
- This is just meant to filter out the "worst" solutions, so you should still end up with a long list of solutions, albeit one that is more manageable than the original list.
Graphical Decision Chart
A 2x2 matrix where the two most important objectives, determined by pairwise comparison, are put on the horizontal and vertical axes respectively. As you move further away from the origin, the relative effectiveness with which each solution fulfills the objective increases.
- The top right quadrant should include the solutions that fulfill the two objectives the most effectively.
- From this, you can choose which solutions to discard, and which ones to keep. For example, you can choose to only keep the ones in the top-right quadrant.
Pugh Method
A variation on pairwise comparison, wherein each solution is compared against a "standard" solution—which is one of the solutions the design team chooses after applying previous methods, or an existing solution external to the design project. These solutions are compared against all the objectives identified in the project.
- The standard solution is not what the design team deems to be the "best" solution; instead, the team should aim to pick a solution that is "around the middle" of the solution pool at achieving each objective.
- This is not required, but makes the comparison more useful.
- This solution is known as the datum, and goes in the first column, and gets a 0 for each objective.
- Every subsequent solution is compared to the datum for each objective
- If it is better than the datum, it receives a +1.
- If it is the same, it receives a 0.
- If it is worse, it receives a -1.
- The final solution should be chosen based on the sum of points given to each solution.
This method is "bad" because:
- It gives each objective the same weight.
- It does factor in how well each solution fulfills each objective, only if it is better/worse than the datum.
Weighted Decision Matrix
This is a modification of the Pugh Method. Instead of comparing against a datum, each solution is given a score based on how well it fulfills each objective.
- Also, each objective is given a weighting based on discussion and pairwise comparison.
- The score that each solution achieves is based on the sum of the scores multiplied by the weights of their corresponding objectives.
| Objectives | Solution 1 | Solution 2 | Solution 3 | Sum |
|---|---|---|---|---|
| O1 (0.45) | 0.1(0.45) | 0.3(0.45) | 0.5(0.45) | ... |
| O2 (0.3) | 0.6(0.3) | 0.2(0.3) | 0.3(0.3) | ... |
| O3 (0.1) | 0.3(0.1) | 0.3(0.1) | 0.9(0.1) | ... |
Example weighted decision matrix above. I am too lazy to calculate the sums but you get the idea.
Research
CRAAP Test
A test (framework?) that helps you determine how good a source is to use.
- Currency
How current is the source, and how much is likely to have changed since it was published? - Relevance
How relevant actually is the source to the thing you're trying find? - Authority
Who am I getting this source from? Are their credentials up to snuff? What are the author's qualifications on the topic? - Accuracy
How accurate is the information they provide? Where does it come from? Is it supported by evidence? Does it seem biased? - Purpose
What is the purpose for which this information has been published? What motives does the author or the organization associated with it have for it being publicized?