APS112 Midterm Review
Judging from past exams, you will be tested on content from last semester. See ESP 1 Studying to review.
Love it when "review" becomes "learning the content for the first time" since I didn't pay attention to any of the lectures 😭
ESP Documents
This section includes information on the various documents that you must write in ESP, excluding those that were covered in APS111.
Status Reports
A status report is a project management tool used in ESP (and in general engineering teams as well) that helps the design team to:
- reflect on the past week's work;
- plan the future week's work;
- keep track of individually-assigned tasks, and;
- note any encountered issues.
In this document, tasks are created and tracked using a Gantt Chart (add link). These tasks must be:
- Specific (e.g., not just "work on CDS"; instead, "research screw standards for structure")
- Assigned to a specific team member
- Tracked in a table and Gantt Chart
The Gantt chart in the status report should include:
- tasks 1-2 weeks ahead and before the current date (i.e., a snapshot and prediction)
- work done during the last period
- who did what and when
Preliminary Literature Review (PLR)
Note: This section won't go much in detail into the assignment, since it's an ESP-exclusive document. If you've done the assignment you should be good for this part.
The PLR is a document that shows how you researched a specific source, with the CRAAP Test used to show how you evaluated the source's "goodness".
Gray Literature
Gray literature consists of source that are not peer-reviewed, but score highly on other categories of the CRAAP Test, such as relevancy or currency.
- Can include popular media, newspaper, blogs, etc.
- These aren't necessarily bad to use.
- They can inform local context or specific aspects of the project where peer-reviewed research is not necessary.
Client Meeting Plan
I'm pretty sure this is supposed to be an actual engineering document, however there's not mention of this in the textbook, so I'm treating it as an ESP document. Thus, I will only include what I deem to be important.
A client meeting plan is a document created by the team to ensure that meetings with a client go smoothly and professionally (particularly the first meeting with the client in ESP). I'm not sure what "real" meeting plans must contain, but in ESP, they should have:
- Opening information
- i.e., title, project name, group number, etc.
- Audience Assessment
- Introduction
- i.e., how you are going to introduce the members in your team to the client
- Information Sheet
- Identifying information for each team member
- List of questions
- Should be both open and closed questions
- Strategies
- Close of meeting
They should also have a brief outline of topics you wish to communicate, prepared as an agenda before the meeting.
Audience Assessment
An audience assessment is a document (or a part of a document, as in the case of ESP) that details the person or people you will be meeting with. If you are meeting with a client, then the assessment will be on your client. It should include info on:
- Who the client is
- What their background level and connection to the project is
- What their level of technical expertise is
- What you hope to achieve in the client meeting
e.g., Assuming a low level of computer knowledge because the client is 60 years old is inappropriate.
Team Role Observation and Analysis (TROA)
An ESP-specific assignment that connects your role, as defined in the Team Charter, to a specific situation that happened this semester. It must include:
- Introduction
- Description
- Analysis
- Conclusion
We have already been tested on the content for this assignment, and specifics of it are not really applicable to real life. If you would like more information on it, please refer to the TROA Assignment Instructions.
Common Engineering Tools and Methods
This section includes various tools and methods that were taught in APS112, including some relevant ones from APS111.
CRAAP Test
The CRAAP test is a test that you can use to identify whether a source is suited for your use. It ranks the source as "strong", "weak", "in-between", or "uncertain" in the following categories:
- Currency
- Relevancy
- Accuracy
- Authority
- Purpose
If a source ranks highly in all categories, then it is a "good" source to use. However, scoring low in some categories does not immediately disqualify a source from being considered; this is just a tool to help you evaluate the strength of a source.
- It also evaluates how a source should be used. For example, if it scores highly on everything but currency, perhaps it can still be used as an example of how things were done historically.
For further information on this tool, see my APS111 notes.
Gantt Chart
A Gantt chart is a project management tool that visualizes a project's tasks and their expected completion length, internal deadlines, and dependencies. They are used in ESP Status Reports.
Components:
- Task number
- Used to order the tasks.
- Ordering is based on which tasks must precede other tasks.
- Task name
- Duration
- How long the task is expected to take.
- Person assigned to the task
- Predecessors
- A task that must be completed before another task is completed.
- The successor is the task that comes after another task,
- Milestone
- A checkpoint in the project that indicates a particularly important point in time.
- e.g. the due date for a project in a university course.
- Critical Path
- The longest chain of tasks (time-wise) that must be completed before the completion of the project.
- The textbook refers to this as the path that always takes the same amount of time as, or more time than, any other path in the Gantt Chart.
- Path in this case meaning a series of connected tasks.
- A critical task is a task that appears within the critical path.
- The longest chain of tasks (time-wise) that must be completed before the completion of the project.
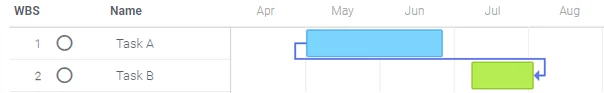
- Slack
- The "free" time after a task has been completed, but before the successor can be started.
- Represented by an arrow.
- Lead time
- The amount of time after the necessary predecessors are completed (or started, depending on the dependency type) and before the successor can be started (again, or finished, depending on the dependency type)
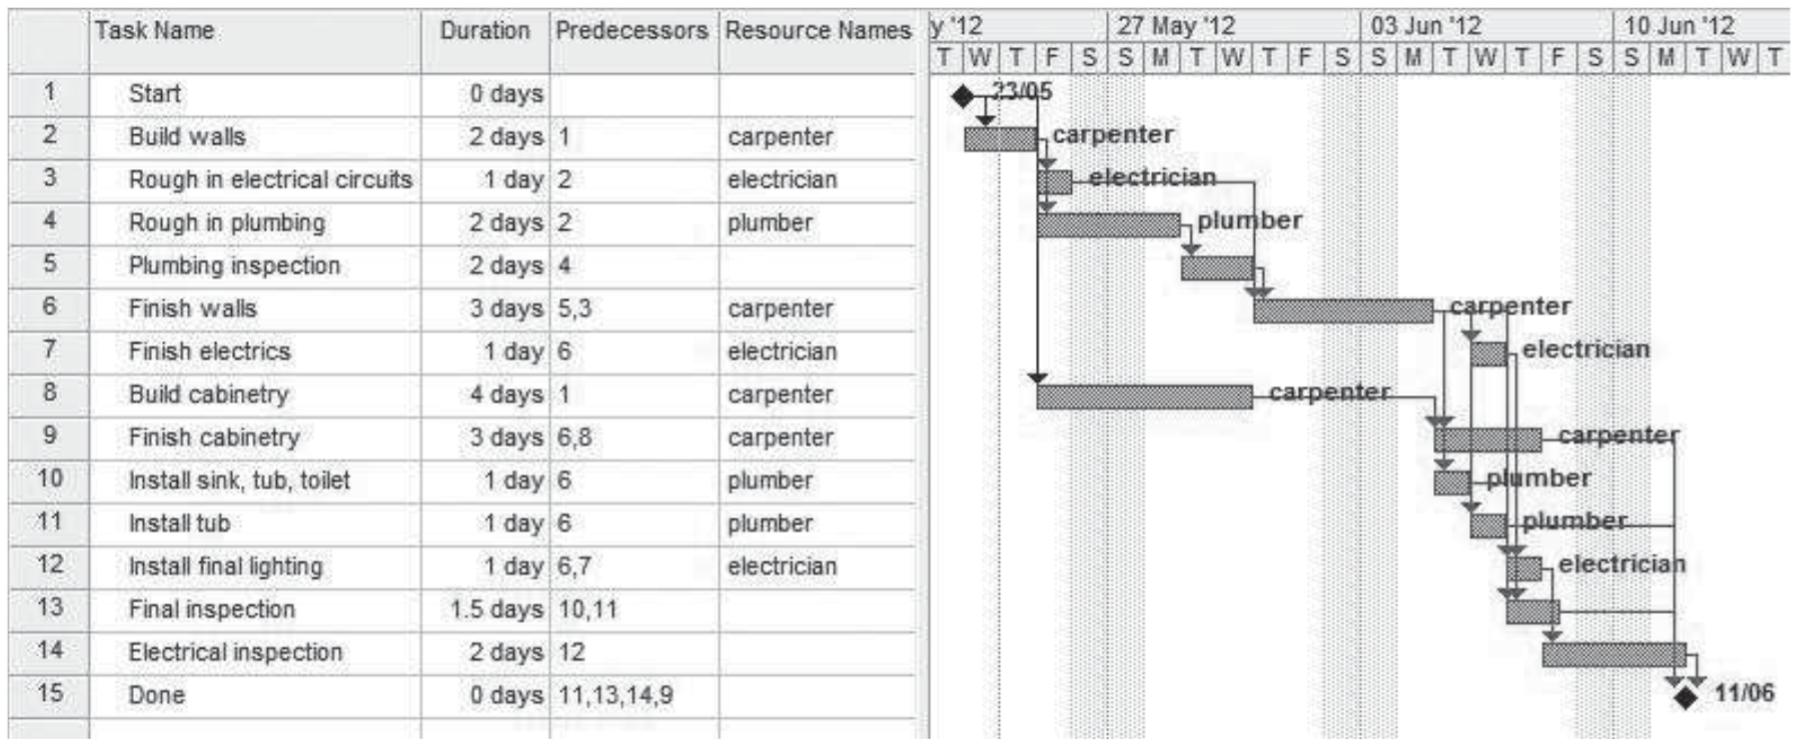
Example Gantt Chart (from textbook)
Gantt Chart Dependencies
Although it was not explained in the slideshow or textbook (from what I could tell), different Gantt Chart dependencies showed up on last year's midterm. Thus, you should know them.
Finish to Start
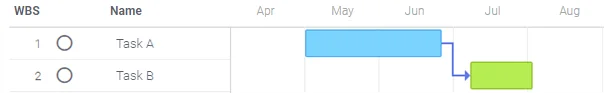
The predecessor's task must be completed before the successor's task can start. This is the most common type, from what I've seen.
Cooking food -> eating the food is a FS dependency
Finish to Finish
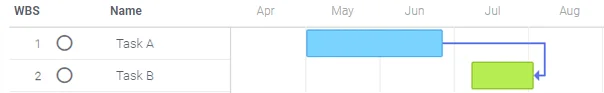
This is either:
- the predecessor's task and the successor's task should finish together
- one task must finish before the other task can finish
Download/installing a Minecraft modpack <-> Installing Minecraft is a FF dependency
Downloading the modpack can occur at the same time as installing MC, but installing Forge and moving the modpack into the correct folder requires Minecraft to have finished installing.
Start to Start
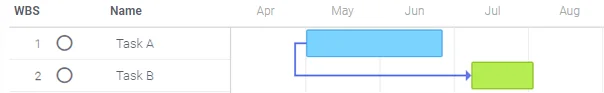
This is where multiple tasks start at the same time.
Starting work on the TC <-> starting work on PR is (kind of) a SS dependency
Both of these are dependent on your team actually getting together before you can begin working on either task.
Start to Finish
The successor can only be completed once the predecessor has started. This is less common than the others, but may occur if the predecessor logically should be ordered above the successor due to its other successors.
I can't lie, I can't think of a good example for this. Someone help me out here.
Program Evaluation and Review Technique (PERT) Chart
A PERT Chart is a tool used to determine ordering of tasks, similar to a Gantt Chart. In a PERT Chart, arrows show the precedence for a simple set of tasks.
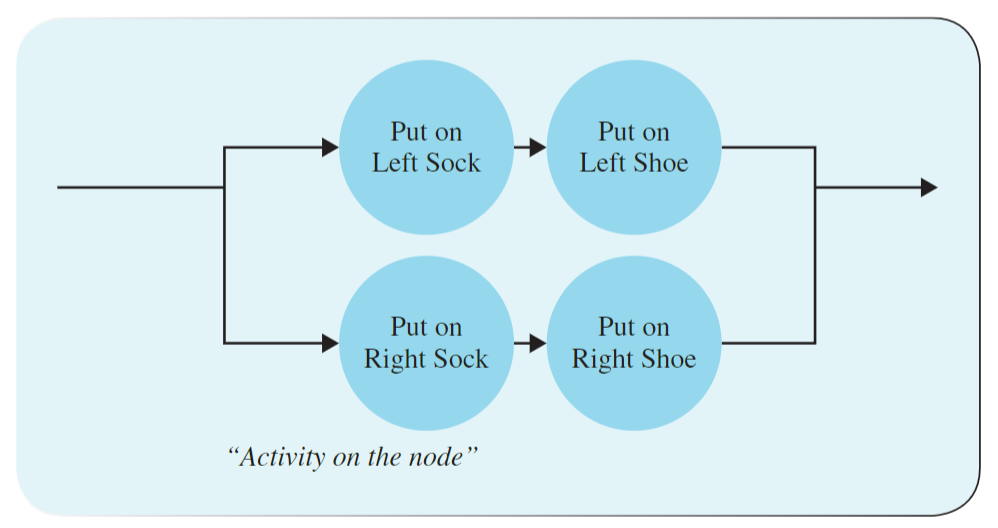
An example PERT Chart for putting on a shoe (from textbook)
In the above example, you can either put on your left sock and shoe first, or your right sock and shoe, but you cannot put your left sock on and then put on your right shoe.
- The arrows indicate that certain tasks must precede specific other tasks.
- Tasks whose ordering does not matter can be done at the same time or in any other order, as long as time and cost permits.
I do not think this will be tested, given that it only showed up for a single slide in lecture, and last year's midterm didn't even mention it.
Measure of Success (MoS)
MoS is a test procedure (often based on a specific metric, usually specified within your Objectives section of PR) used to actually test a proposed design.
MoS can be backed up by multiple types of evidence:
- Prototyping
- Create an actual physical prototype of a proposed design to determine if it meets a specific objective.
- The prototype does not have to be fully functional; it could be a low-fidelity prototype, which means that it is as inexpensive and easy-to-make as possible.
- Models/simulation
- Using a numerical model (linear regression or whatever else) or computer simulation of your proposed design (e.g. CFD) to determine how well a proposed design meets a specified metric
- Estimation
- Based on research and rough calculations, how well does a proposed design meet the specified objective?
- Calculation
- Using various aspects of the proposed design (size, weight, etc.) to calculate a metric.
Engineering Notebook
An engineering notebook is a written document (either handwritten or typed) that contains the all the thoughts and activities pertaining to an engineer's work on a design, including both observation and experimentation.
Howard M. Kanare, Writing the Laboratory Notebook, American Chemical Society, Washington D.C., 1985 — stolen from the slideshow
Engineering notebooks are meant to be clear, and must have the information necessary for an equally-skilled person to be able to replicate or continue the design team's work using the information in the notebook.
- This means that it must be readable, with relevant diagrams, labels, and annotations.
- In nations that are first-to-invent, an engineering notebook can establish invention dates.
- In nations that are first-to-file, an engineering notebook can identify inventors.
Teamwork
This section covers various aspects of teamwork discussed in lecture.
Working Styles
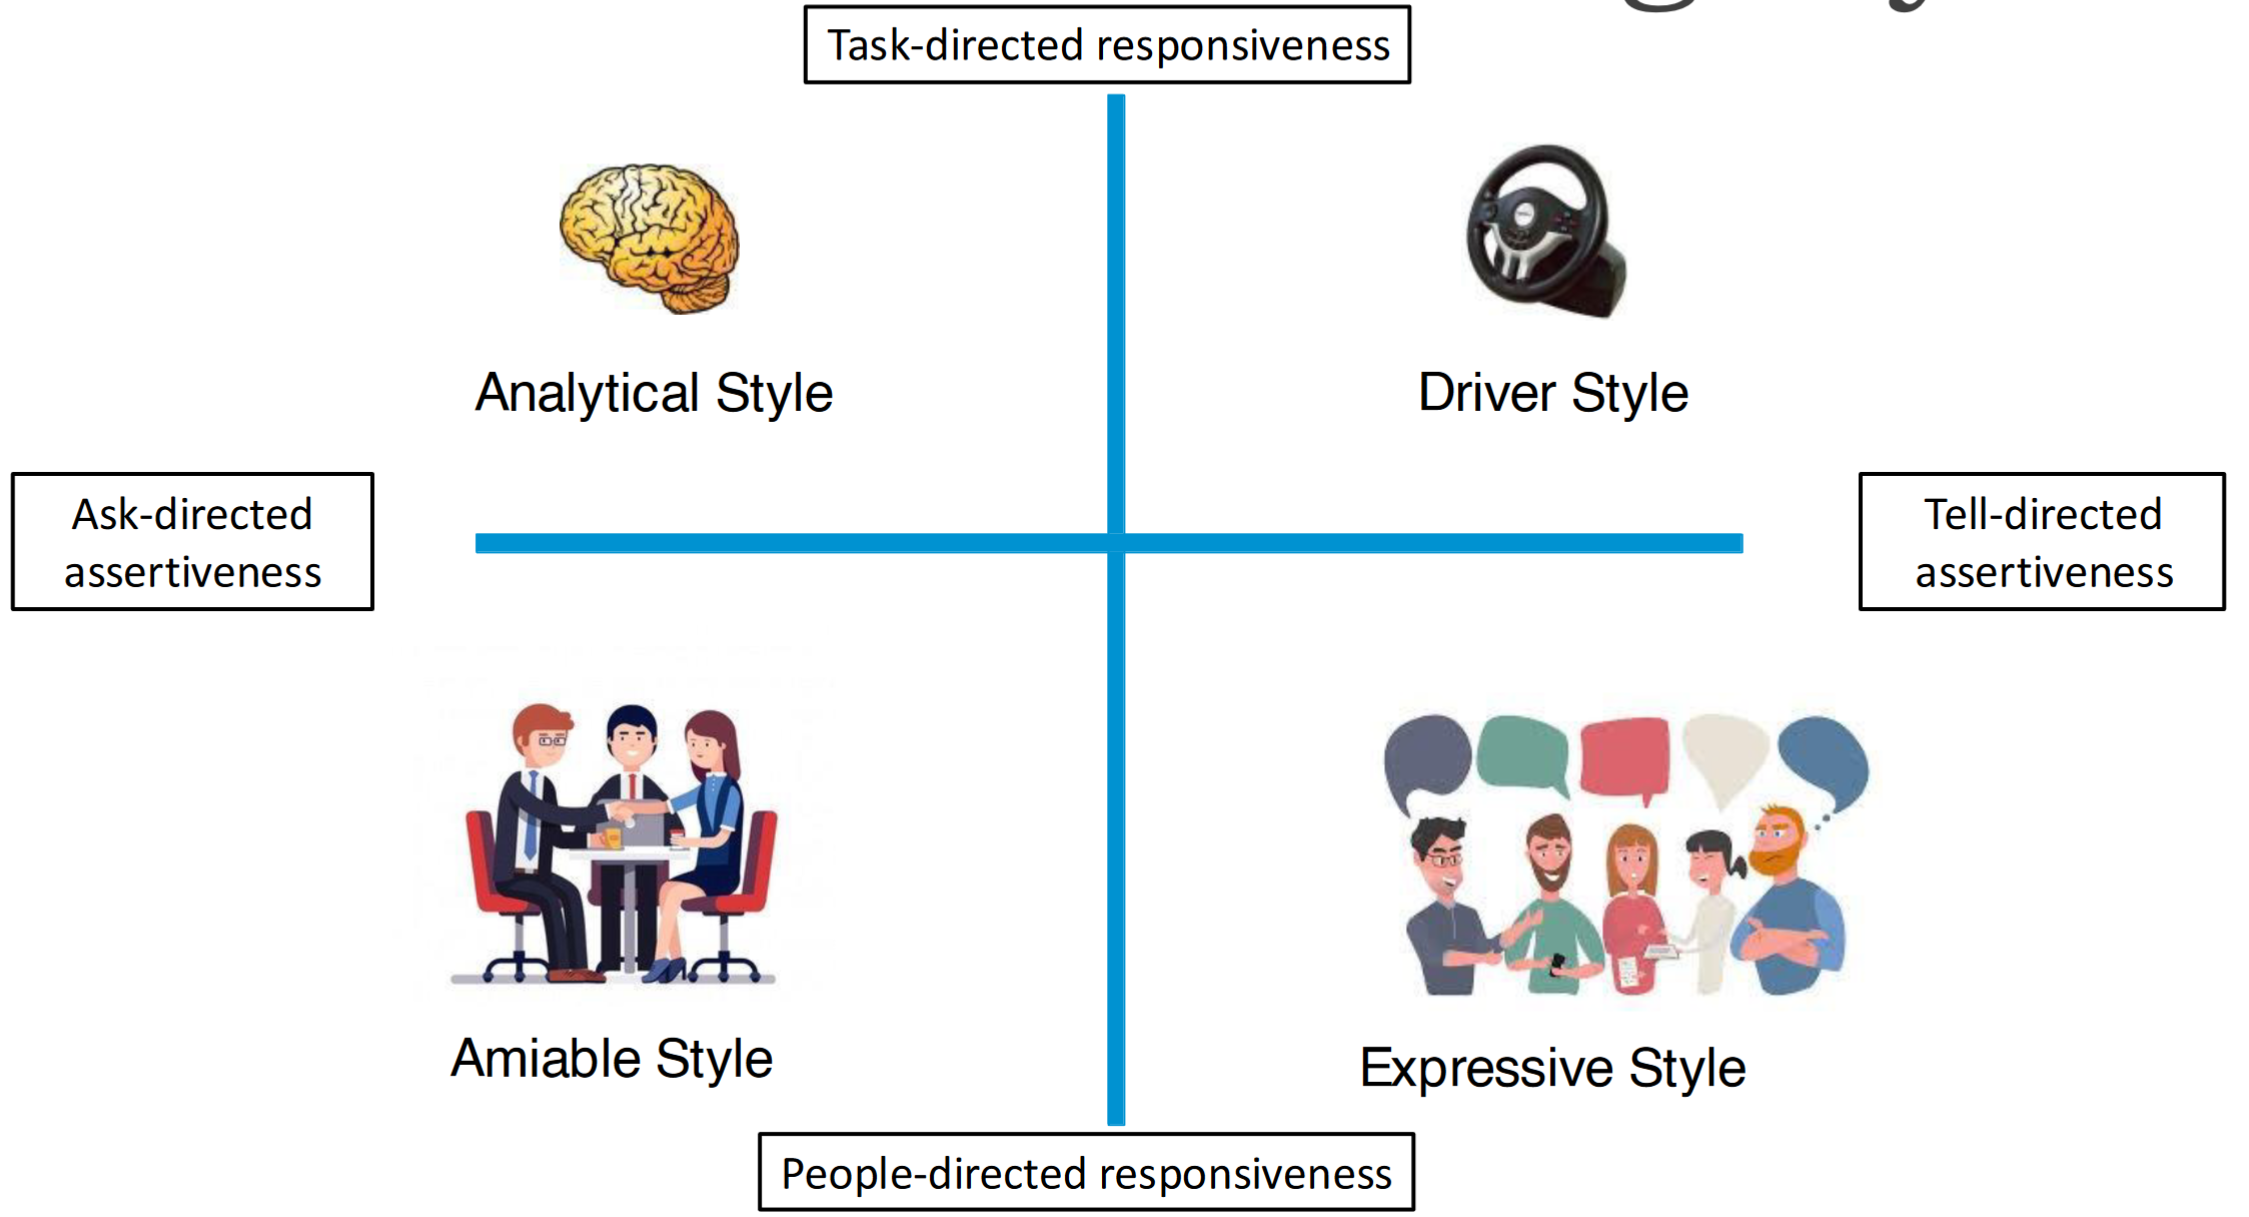
According to ESP, there are four different working styles.
These are very general and not necessarily permanent; someone might dip into multiple quadrants.
Knowing your working style, and the working styles of your team members, is important for ensuring that you get along well—particularly when dealing with high stress situations.
Analytical Style
Characterized by asking rather than bossing other people around, and responding to the tasks at hand, rather than responding based on people (i.e., how they react)?
| Traits | Strengths | Weaknesses | Reactions to Stress |
|---|---|---|---|
| Detail oriented | High standards | Nitpicky | Avoids conflict |
| Needs data and information | Stays on task | Bureaucratic | Physically or emotionally withdrawn...? |
| NOT a risk taker | Organized | Slow to act | |
| Works best alone or in small groups |
Note that the slides say that working styles are distinct from personality traits, as you could work differently than otherwise suggested by your personality. Okay buddy.
This is the working style that most engineers adopt I think (judging based on response in lecture)
Driver Style
Characterized by telling other people what to do rather than asking, and responding to the tasks at hand, rather than responding based on people (i.e., how they react)?

| Traits | Strengths | Weaknesses | Reactions to Stress |
|---|---|---|---|
| Results oriented | Sets realistic goals | Makes decisions even if unsure | Speeds up (not sure what this means) |
| Likes fast-paced environments | Makes decisions for the team | Most likely to be indecisive | Becomes controlling of other team members |
| Good at time management | Doesn't show concern easily (i.e., everything is okay) | Dismisses other people's ideas | |
| Very upfront with requests or criticism |
Amiable Style
Characterized by asking other people topics rather than bossing other people around, and responding based on people (i.e., how they react/emotions) rather than tasks at hand?
| Traits | Strengths | Weaknesses | Reactions to Stress |
|---|---|---|---|
| Unites people | Organized | Can get side-tracked helping others | Becomes too accommodating of others |
| Works well in a small team | Encouraging and good listener | Slow to form opinions | Refrains from sharing their own ideas |
| Doesn't like being at the centre of attention | Synthesizes opinions/points | Withholds criticism | Too agreable |
| Builds team cohesion |
Expressive Style
Characterized by bossing other people around(?), and responding based on people (i.e., how they react/emotions) rather than the tasks at hand?
| Traits | Strengths | Weaknesses | Reactions to Stress |
|---|---|---|---|
| Likes to be the centre of attention | Creative | May act before thinking | Quick to anger and apologize |
| Energetic | Visionary | Not always good at time management | May take frustration out on other people (verbally??? physically??? idk) |
| Strong group worker | Relates to strangers easily | May monopolize conversations | |
| Very, well, expressive (emotionally) |
The antithesis of most engineers
Abridged Summary of Working Styles
This is basically just so that I can remember these better; they are in no way a reflection of what the teaching team wants you to be taking away from this, but idgaf.
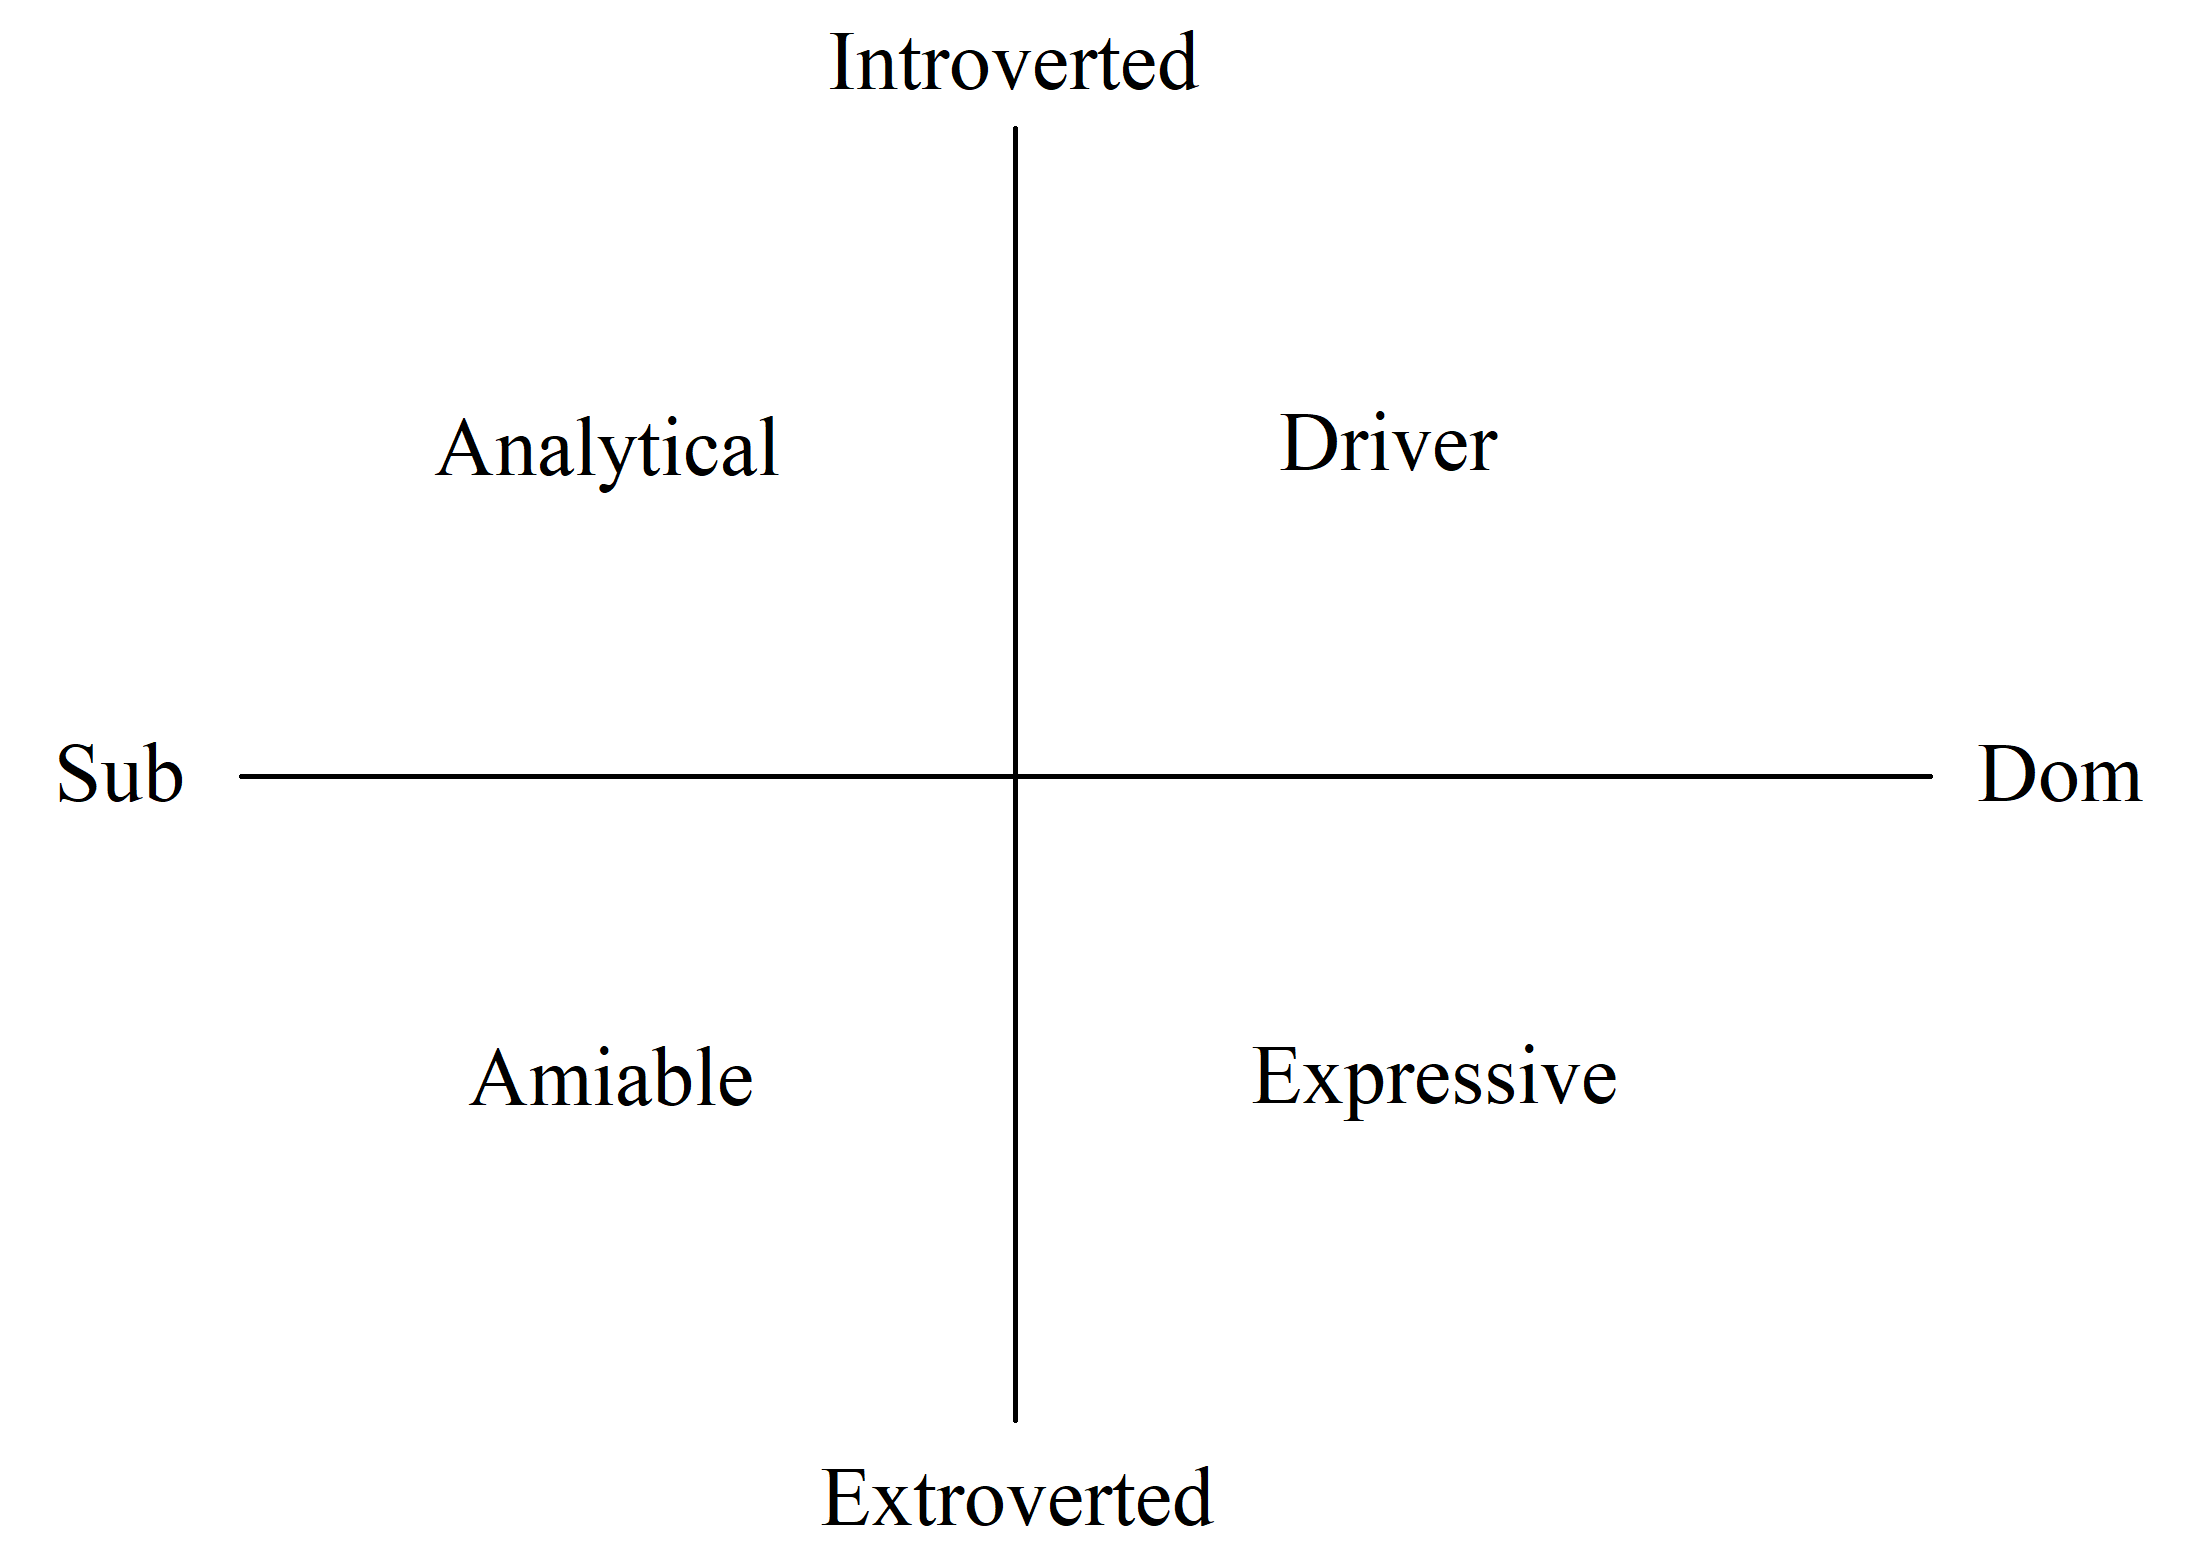
Pictured: ESP working styles sorted by introversion/extroversion and BDSM position.
Common Team Roles
Three roles are required for every team. These are:
- Leaders
- Focused on supporting the people working on the project by ensuring the working environment is adequate.
- Deals with the different personalities and working styles of team members.
- Project Managers
- Focused on supporting the project from a high-level POV, i.e., timelines and task distribution.
- Communication Liaison
- The single point of contact between the design team and individuals outside of the team, such as the client and stakeholders.
Other possible roles include:
- Schedule Coordinator
- Specialists (for a specific type of task)
- Editor
- Multimodality Coordinator
- Quality Assurance Coordinator
Visualization Techniques and Tools
This section lists various techniques and tools used in engineering contexts to visualize information. It is important to visualize information effectively in engineering because words are not always the most effective way to communicate information. In fact, a lot of engineers suck at writing (case in point: your peers probably), so implementing effective information visualizations is very important.
Only the ones that I think are particularly notable are included. For example, I'm not including "highlighting your image" because that's common sense really.
Schematic Drawings
These are drawings that consist of commonly-used symbols and lines to convey information, e.g. a circuit diagram.
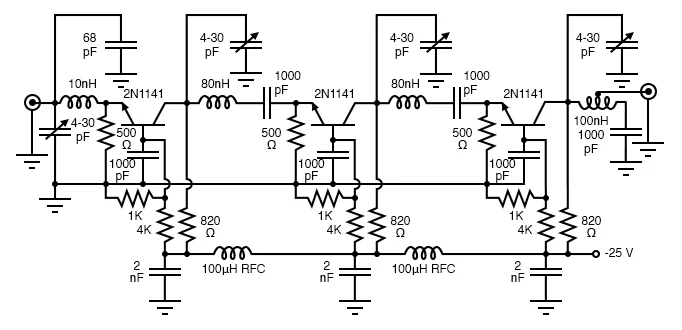
Schematic diagram of something or other (idk i found it online)
Flowchart
A flowchart is a diagram that lists several processes and connects them using arrows and other common flowchart symbols, such as the start, decision, and end. This can include loops.
- It's basically a big if else tree with while loops in it; often used for coding (pseudocode)
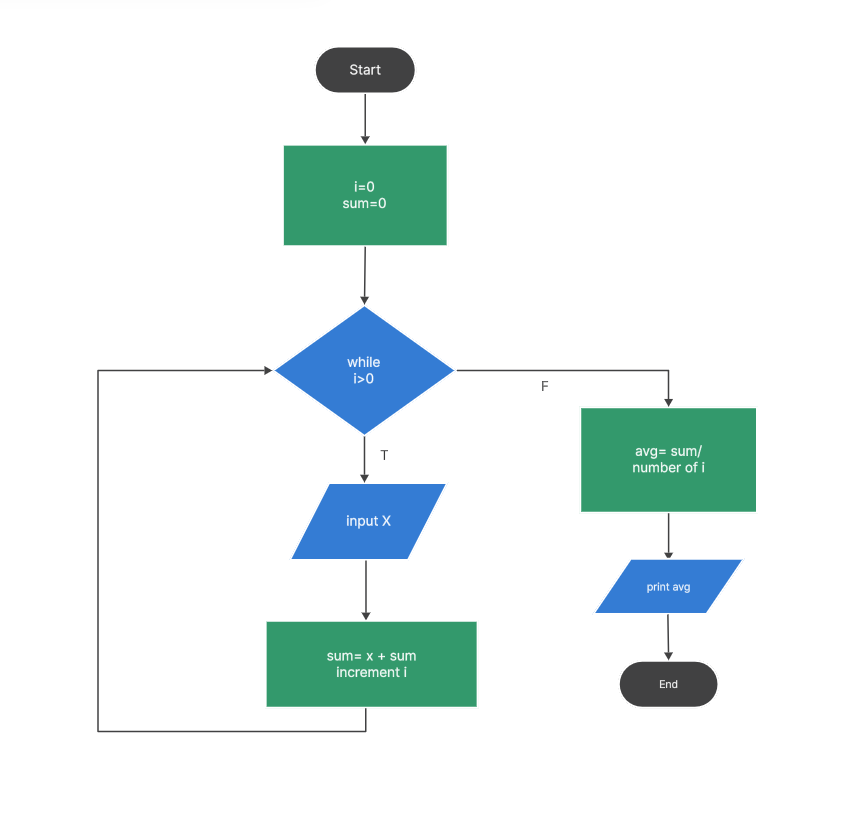
An example of a flowchart
Mechanical/Construction Drawings
These are generally very complex and detailed drawings of physical parts from multiple angles, including measurements and using common standards.
Orthographic Drawings
This is a type of visualization method whereby a 3D object is represented in 2 dimensions.
- To do this effectively, the object is drawn from multiple viewpoints (e.g., front, back, side, etc.)
- An additional isometric diagram is usually added, which shows the 3D object from a perspective in which all three dimensions are equally foreshortened such that the angle between axes is 120 degrees.
- All lines in a specific axis are parallel to one another. Thus, there is no "perspective" represented.
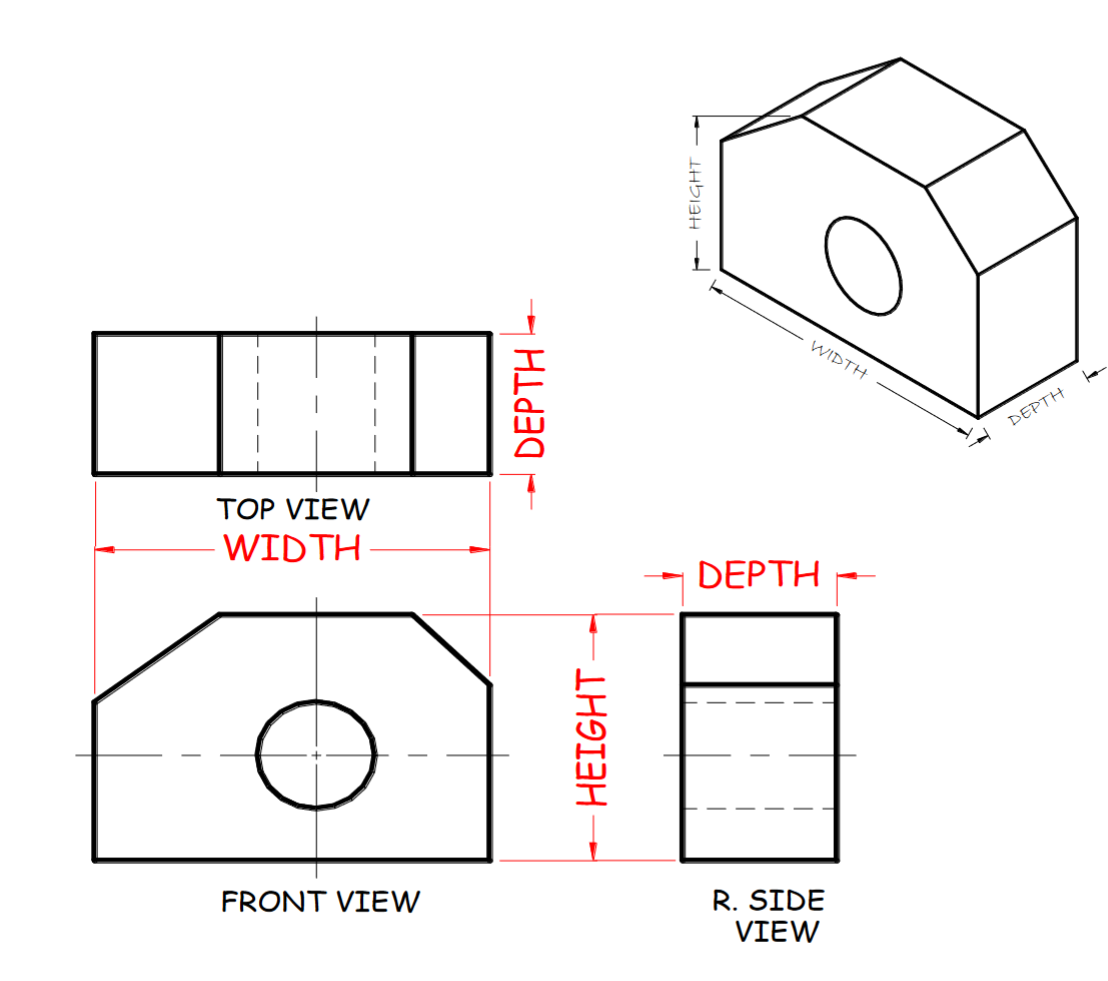
Example of a set of orthographic diagrams
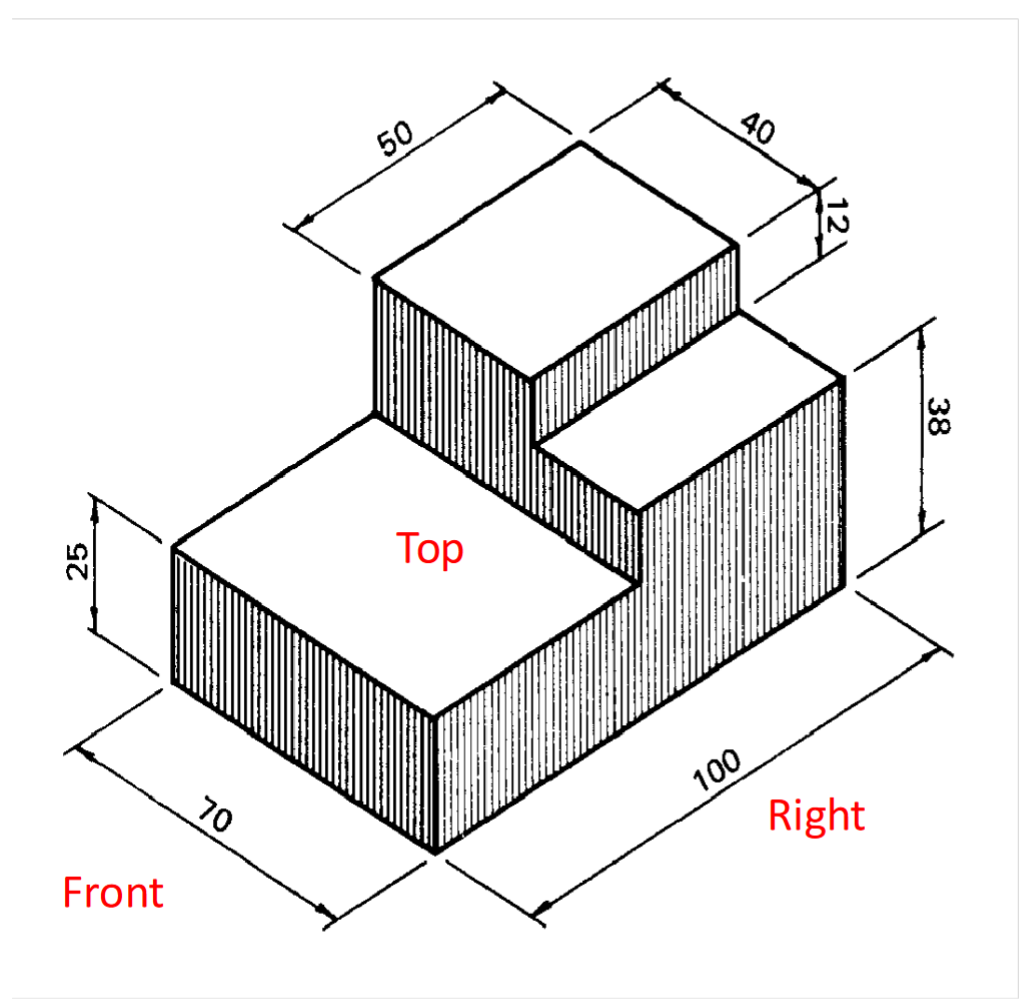
Example of an isometric diagram
Cutaway Drawings
A type of diagram or photo in which an object is cut partway through to show its insides, often used in biology to depict the insides of organs or other biological material.
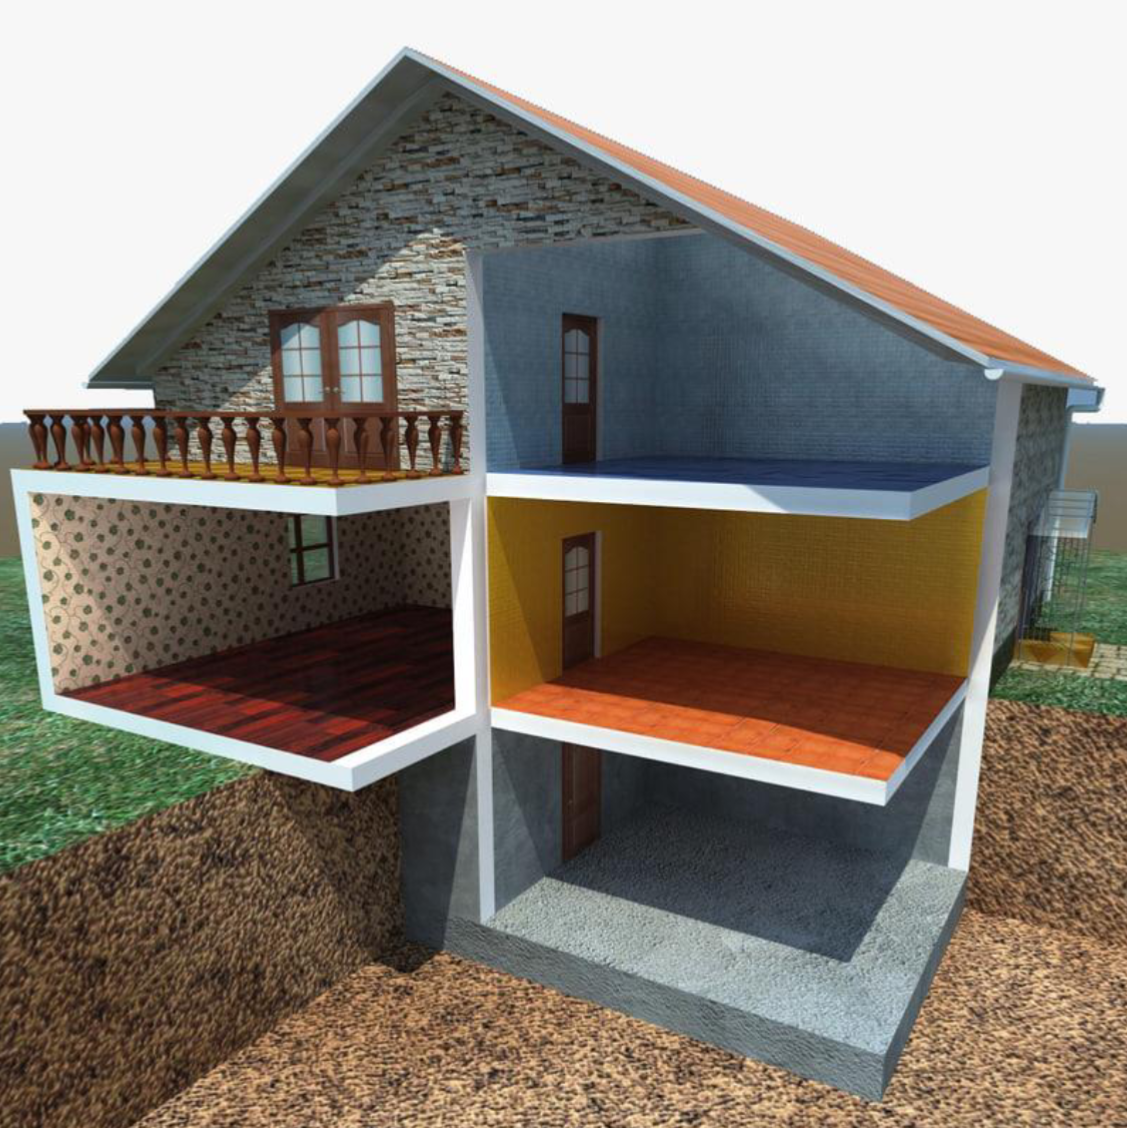
Pictured: house
Assembly Drawings
McGill Engineering Design website
- Side note: why do I have to look on McGill's engineering design website for information that is covered on the UofT engineering design midterm...? Why is this not taught properly in lecture???
An assembly drawing is a diagram in which the various parts for a design are shown together in the places where they are meant to go. If the design in an assembly drawing is part of a bigger assembly, it is known as a subassembly.
- These drawings typically incorporate orthographic/isometric projections, but what differentiates them from orthographic drawings is that they depict full assemblies rather than individual components.
- They also aren't necessarily isometric (I think?)
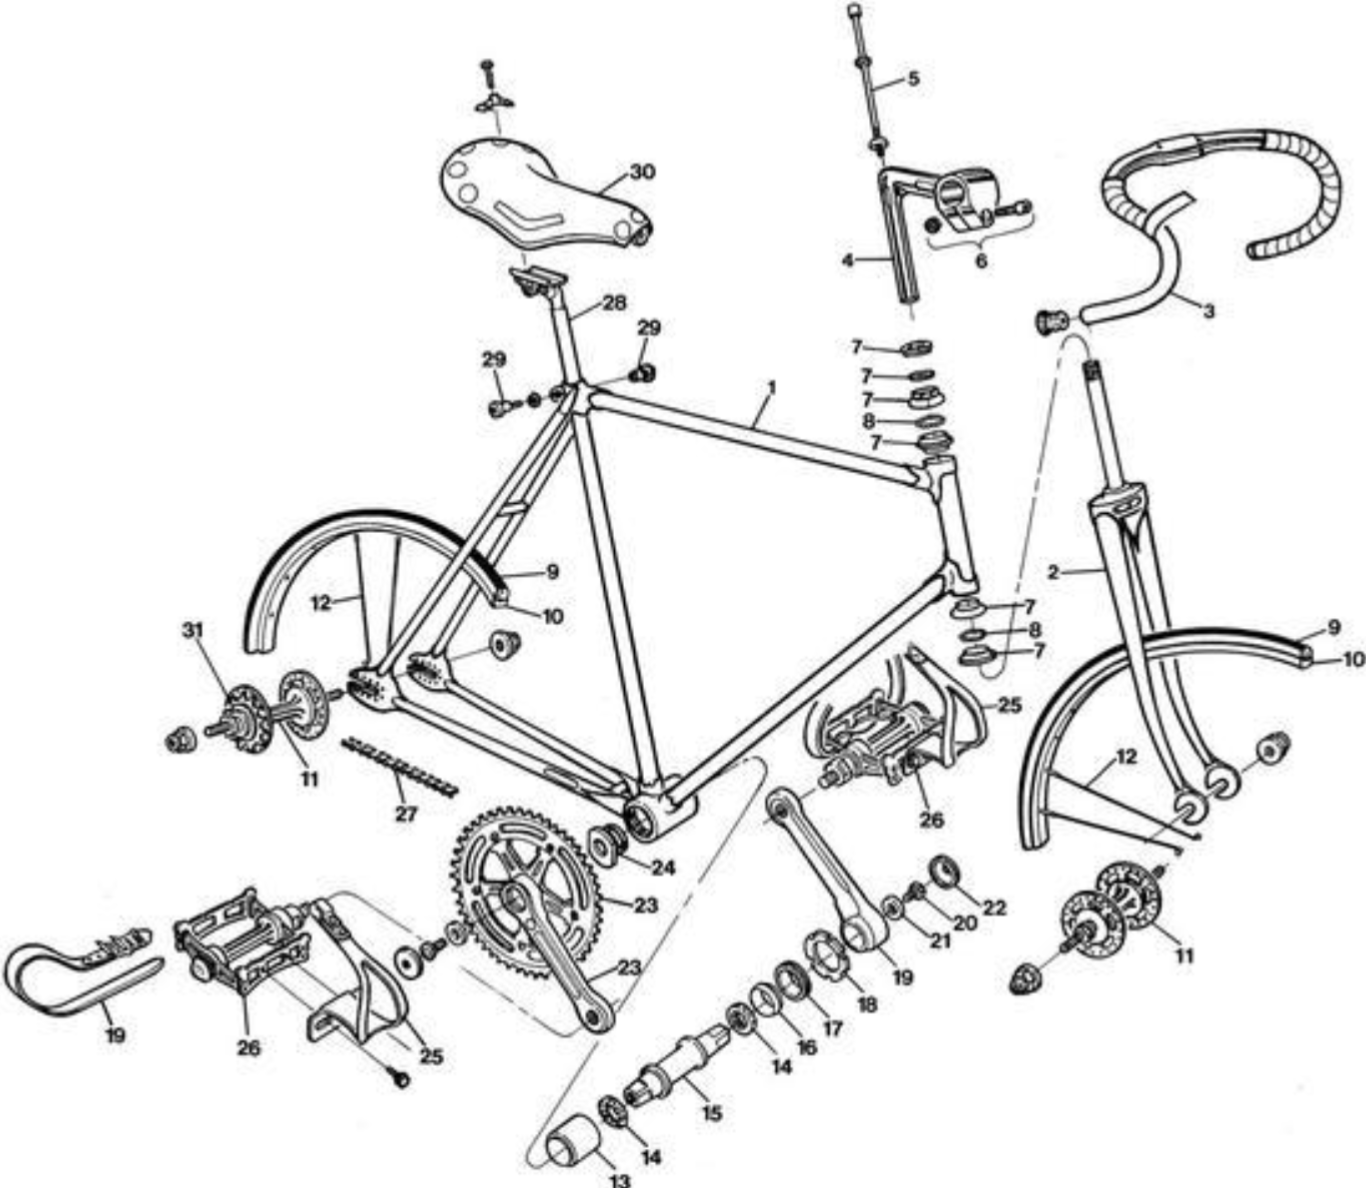
Pictured: bike assembly drawing
Design for X (DFX)
Design for X (DFX) is the process of considering all relevant aspects of the manufacturing, use, and decommissioning of a designed product or service. It consists of considerations of:
- Human Factors
- Safety
- Environment
- Reliability
- Maintenance/repair
- Manufacture
- Assembly
Design for Human Factors
For human-facing technologies (i.e., most of them), the user is heavily considered in the design process. This is known as designing for human factors.
According to the textbook, there are five main levels at which humans interact with technology. Bazylak referred to it as the "human tech ladder".
- Physically
- This area deals with the physical characteristics of users.
- When dealing with human factors, anthropomorphic data—which is information on the physical size, shape, and characteristics of a range of users—is gathered.
- Psychologically
- Describes people's cognitive and emotional abilities.
- e.g. how much can a person remember in short term memory.
- Socially
- The ways people interact with each other.
- Organizationally
- The ways groups of people operate collectively so that efforts of one part of an organization are supported by other parts.
- Distinct from social level because this is specifically in organized groups?
- Politically
- The cultural and societal norms in the environment that the design is implemented in.
Anthropomorphic data is information on the physical human characteristics of the range of users for a design.
Nowadays, designers aim to design for as wide a range of users as possible, in consideration of all these levels; this is known as ergonomics.
The practice of designing technology to work effectively with all people of all levels (physical, psychological, etc.) is known as ergonomics.
Additionally, consideration of users is almost always put at the centre of the design process. This is known as user/human-centered design
The process of putting the users at the centre of the design process; this means making the technology fit them, on all human factor levels, instead of the other way around.
Recently, a specific form of user-centered design, known as User Experience Design (UXD), has become more popular. In it, the experience of using the design, rather than what the user is actually capable of doing, is considered.
User Experience Design is the consideration of a user's experience when interacting with the design, rather than simply if they are capable of working with it. This is a subset of human factors design.
Participatory and Universal Design
To ensure that your design is human-centered, you can use the following approaches:
- participatory design
- universal design
Participatory design is the process of including a target user group in the design process itself as members of the design team.
An approach that uses a set of principles to design for a broad range of users.
Note: This is similar to ergonomics, but what (I think) differentiates it is that ergonomics focuses on addressing all levels of human interaction (physical, psychological, etc.) whereas universal design is more broadly designing for all kinds of users, using a set of design principles.
The North Carolina State University Center for Universal Design outlines 7 core principles for universal design. They are:
- Equitable use
- Access is provided to all users equitably (e.g., ramp is primary form of access to building rather than placed in the back)
- Flexible use
- There are multiple ways of accessing/using the design (e.g., buttons with braille + visual identifiers + sound)
- Simple and intuitive to use
- Perceptible information
- Users can access/use design regardless of condition (e.g., cell phone w/ high brightness to be seen outdoors or if user has low vision)
- Tolerance for error
- Access/usability is not compromised by small user error (e.g., confirm screen when user clicks uninstall)
- Low physical effort
- Design should not require significant physical effort on the part of the user
- Size and space
- Design should accommodate a wide range of sizes and spaces that a user might have (e.g., air fryer should not take up the whole kitchen)
Design for Safety
Safety is often a major concern in engineering because your design might have the capacity to injure or kill many people (#lockheedmartin). Thus, designing for safety is a big part of DFX. The textbook has a lot of fluff about following safety codes and whatnot, but I think most of that is pretty common sense anyway. Below are a few important terms you may need to know for this section:
| Hazard | A situation where damage to health, property, or the environment is possible. |
|---|---|
| Probablitity | The chance of a hazard occurring. |
| Consequence | The result of being exposed to a hazard. |
| Severity/cost | The amount of destruction that may occur due to a hazard. |
| Risk | |
| Safety | Protection of hazards |
| Risk analysis | A statistical tool for determining risk; see Risk Matrix Analysis. |
| Accident | Unintentional exposure to hazard. |
| Acceptable risk | Risks judged to be acceptable; |
Risk Matrix Analysis
A risk matrix analysis basically just plots
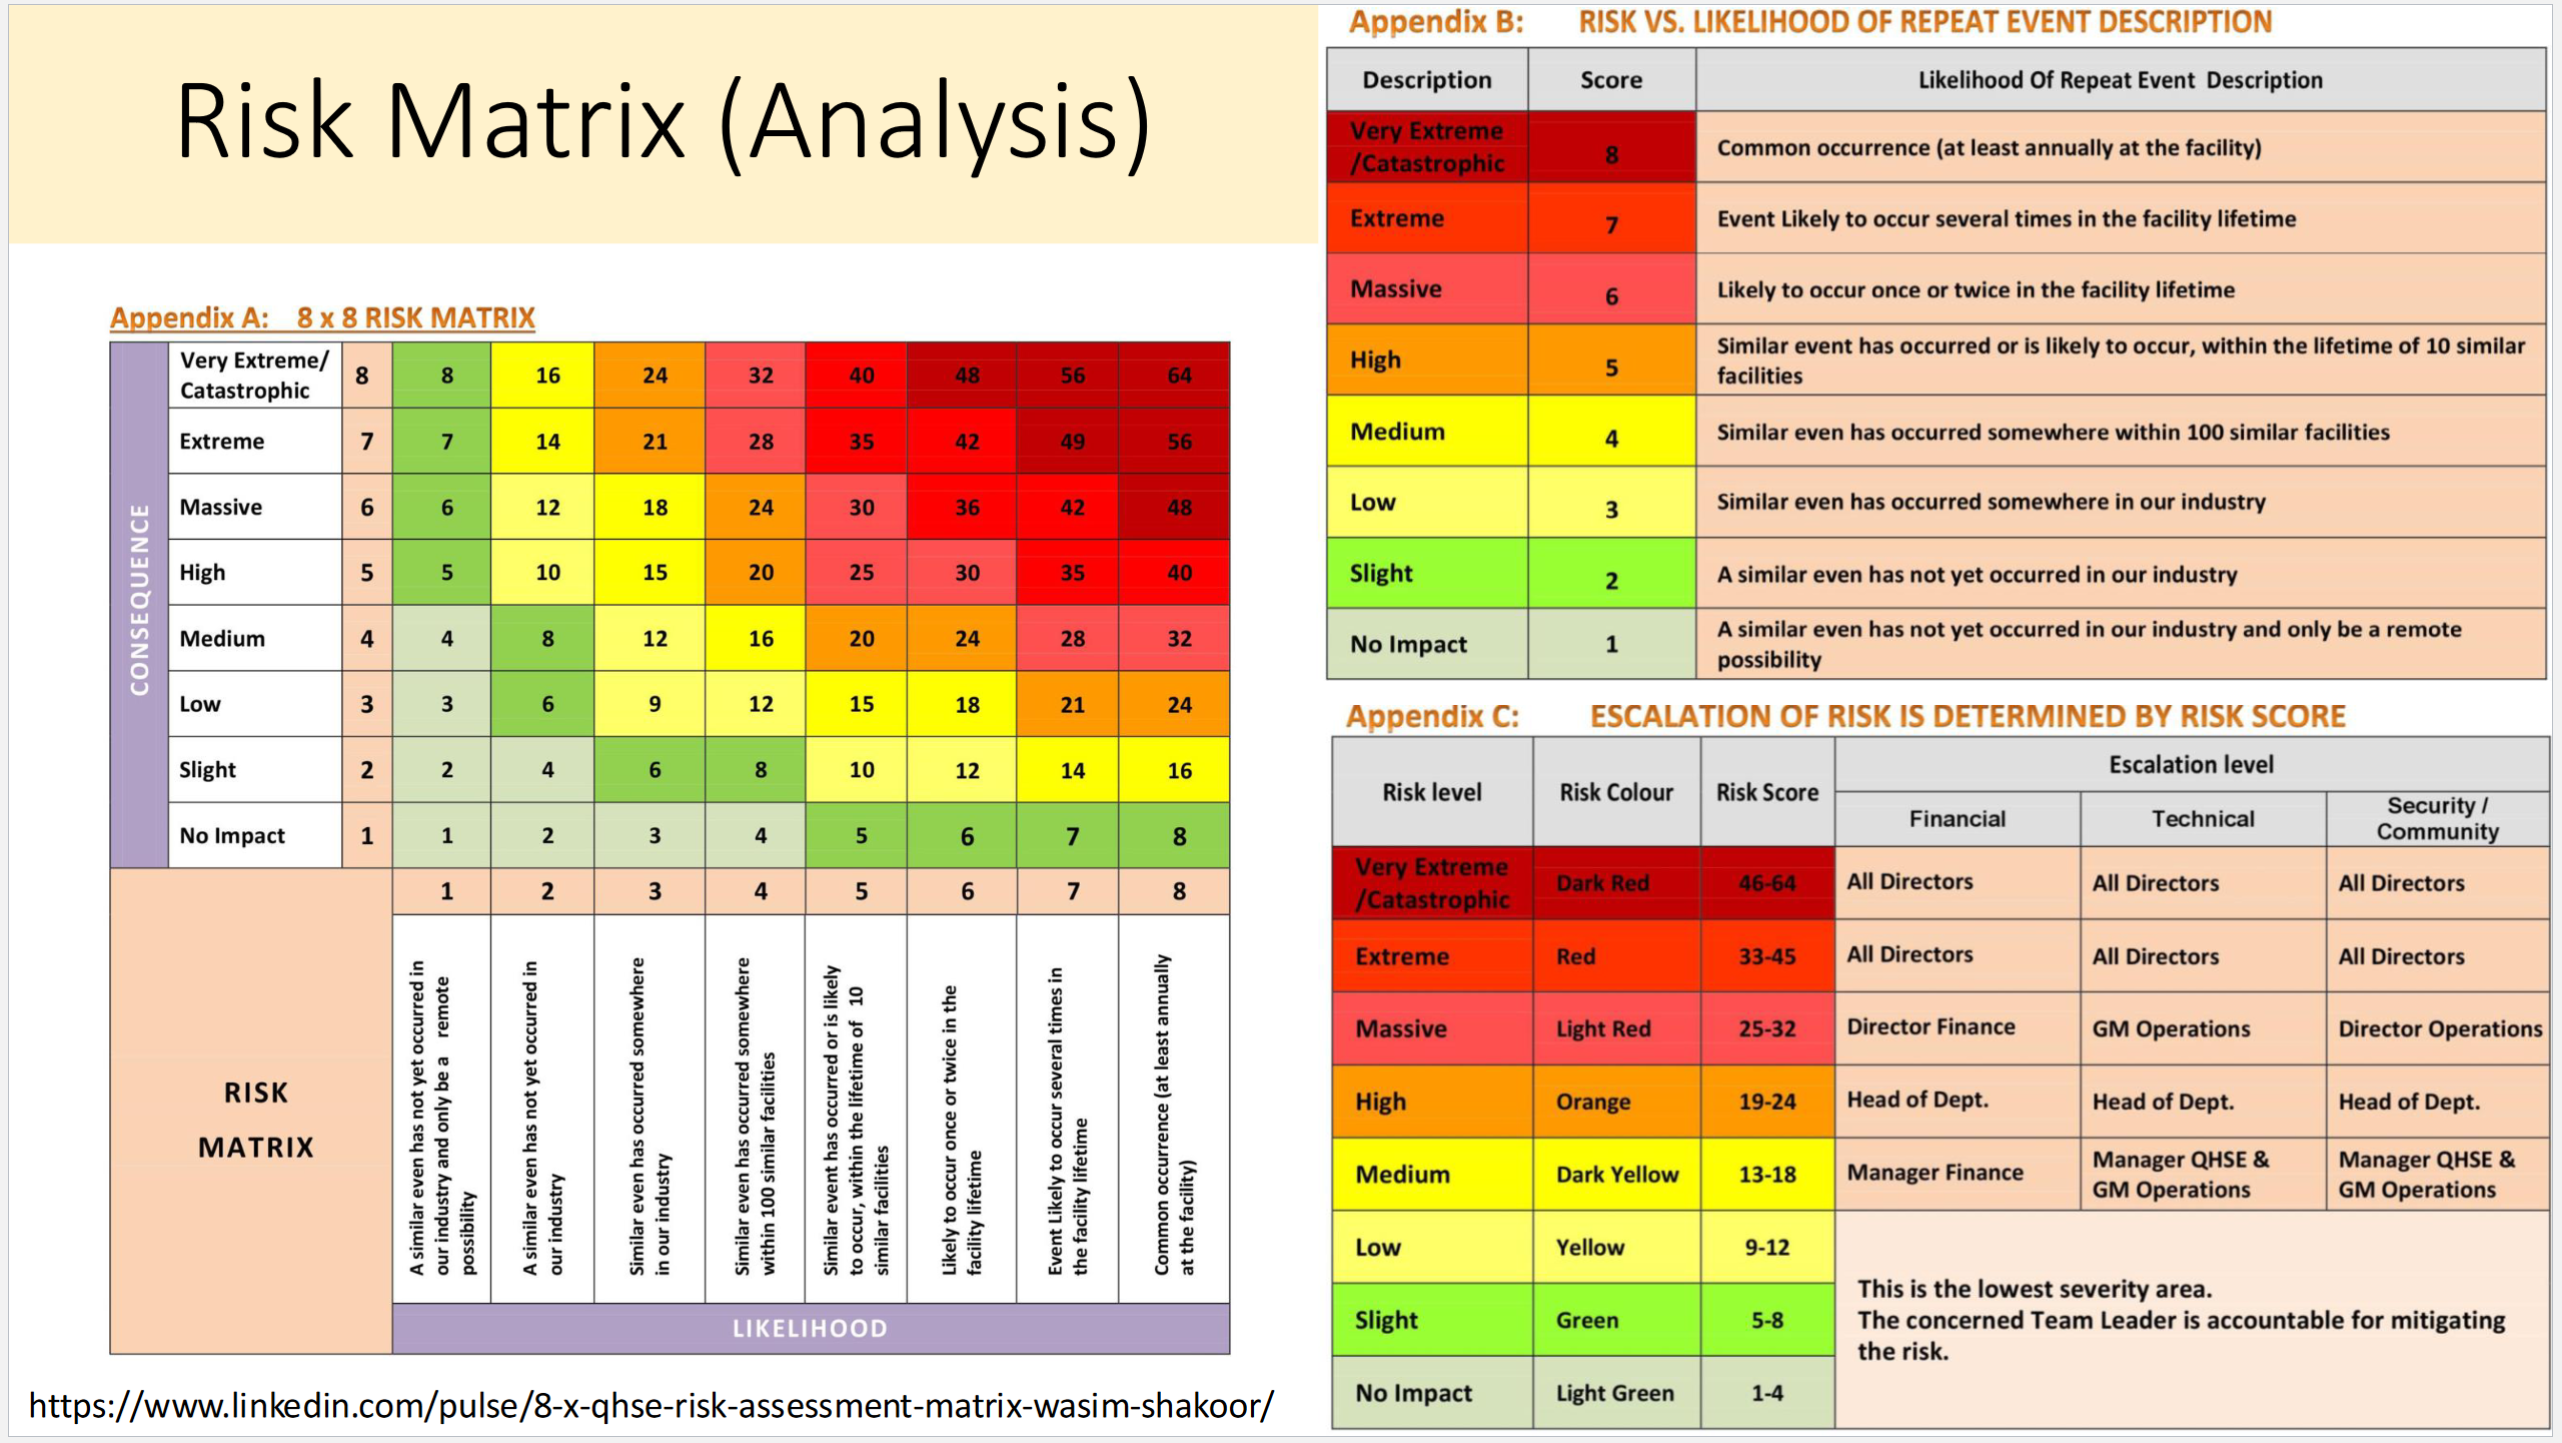
Slideshow example of a risk analysis
There are other factors that contribute to a risk being deemed "acceptable", such as duration of exposure. Additionally, judgement of risk varies greatly by group or individual. Regrettably, financial cost is often a big contributor to the risk calculation. ↩︎